
Don't Go Home
Don't Go Home
Go Big: The Case for Value in Big Lots, Inc (NYSE: BIG US)

## Not. Investing. Advice! Do your own research, monkeys ##
US retail is having a little wobble at the moment, driven by excess inventory levels: basically, COVID caused demand to surge (lots of free money, and more disposable income), but supply chains collapsed, so the retailers’ incentives were to stock up on inventories to meet demand, and to avoid being caught short of supply. Now that demand is cooling, lots of retailers – from Amazon to Target – have found themselves with more inventory than they want. To “right-size” (i.e. get rid of…) their inventory, they will have to sell them with higher mark-downs, which will generally hurt gross margins. In the very very very margin sensitive retail business, this will hurt earnings, and, in today’s cautious environment, any whiff of negative news has led to people dumping pretty much anything in the category.
One name that has not been spared is US discount retailer Big Lots, Inc (‘BIG’), which is currently trading hands at ~$23.03/share (close as of 12/07/22); at 28.6m diluted shares outstanding, the total equity of the company is worth in the region of $659m. For a company that has earned an average net income of $167m per year for the past decade – and has demolished its share count in the process – this looked too enticing for me to pass up. Yes, they have inventory problems, too (ironic, as you’ll see), but do they have such terrible problems that really warrant such a doozy of a price? Amory doesn’t think so.
The Business
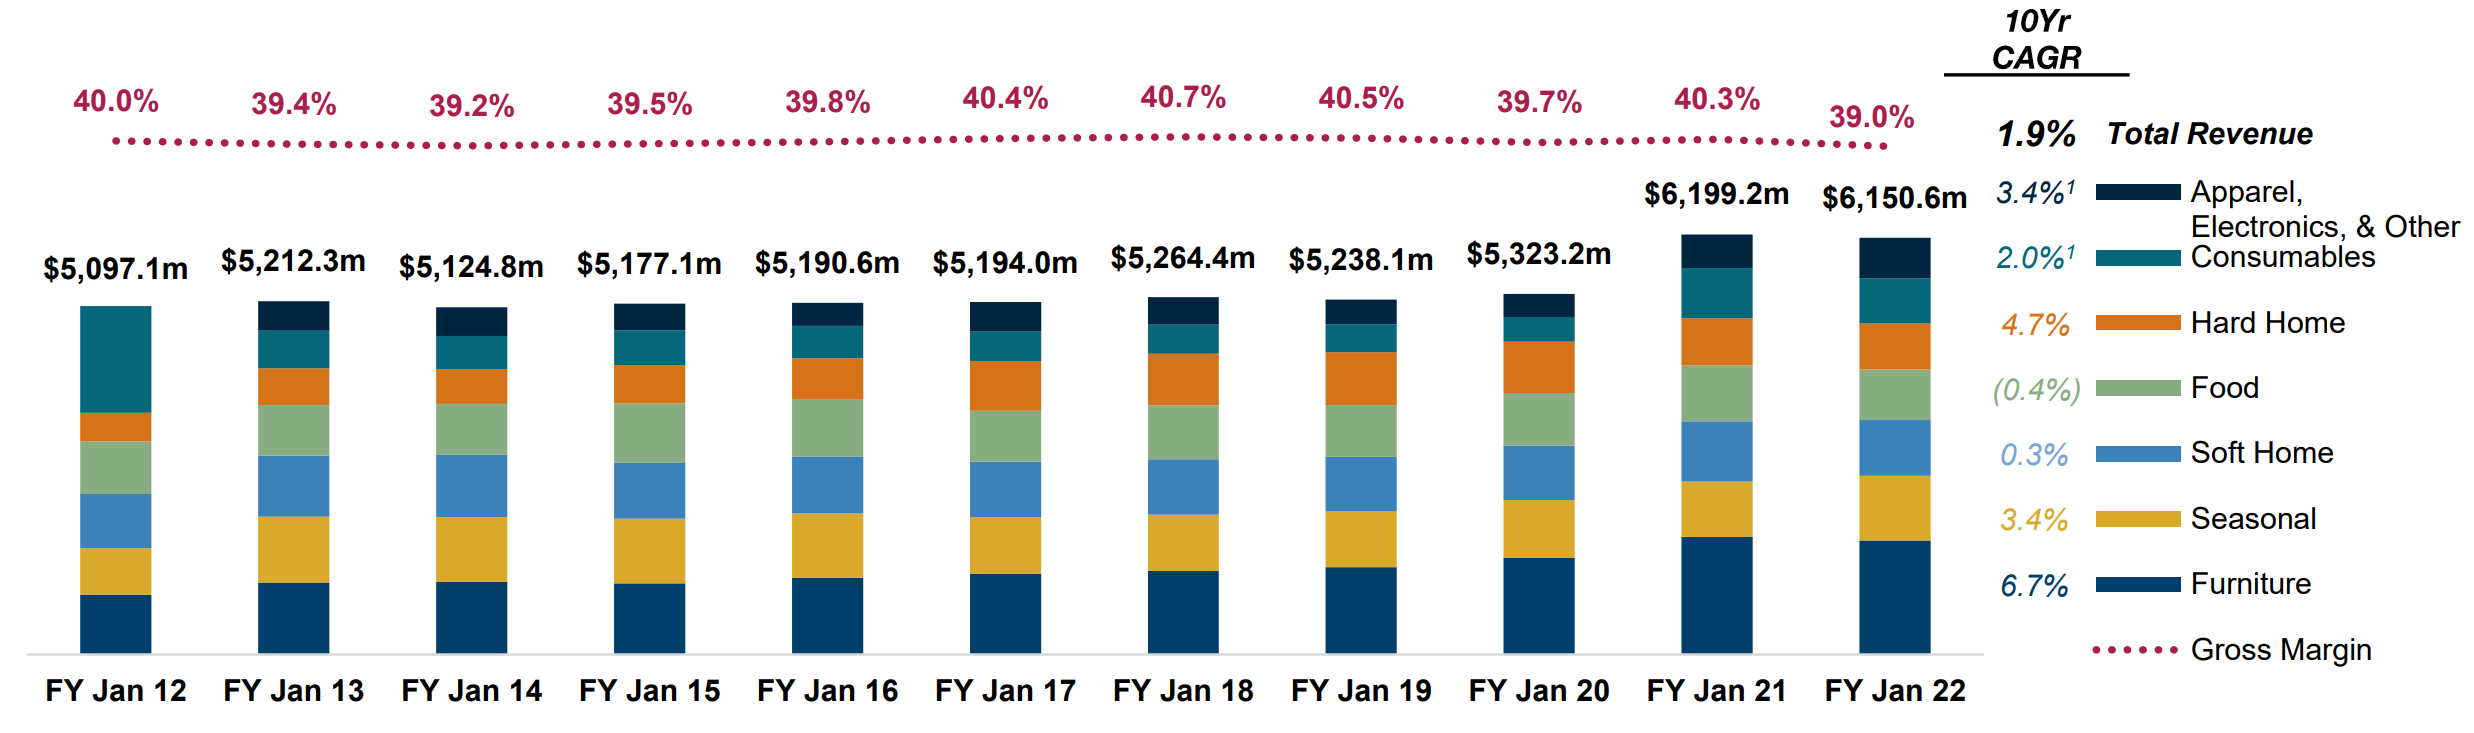
BIG is a big-box US retail player, specialising in discount merchandise across categories. It has its origins in what is known as closeout: buying excess inventory from other retailers in bulk – negotiating fat RRP discounts in the process – and passing on most of that saving to its cost-conscious, bargain-hunting customers (now you see why inventory problems are a little rich). After a few closeout mergers and acquisitions, the company listed on the New York Stock Exchange in 1985 as Consolidated International, before changing its name, and the name of all its stores, to Big Lots in 2001. Today, the company is organised into seven sales segments, the largest of which is Furniture, accounting for $1.7bn of sales in FY21 (27.4%). The remaining six segments, in descending order of sales contribution, are:
Seasonal – 15.5% (things like Christmas lights, barbeques)
Soft Home – 13.4% (sheets, cushions)
Food – 12.1% (you know, food)
Hard Home – 11.0% (cutlery, picture frames)
Consumables – 10.8% (washing detergent, razors)
Apparel, Electronics, and Other – 9.8% (you can work this one out)
Revenue was $6.2bn in FY21, representing a 1.9% compounded average growth rate (‘CAGR’) over the past decade. However, you can pretty easily see a meaningful COVID bump for sales in the chart below: FY19 sales of $5.3bn jumped 16.5% to $6.2bn in FY20, where they stayed basically flat into FY21. Looking at the CAGR to FY19, a more normal growth picture, revenue grew 0.54% annually, not an overly punchy number.
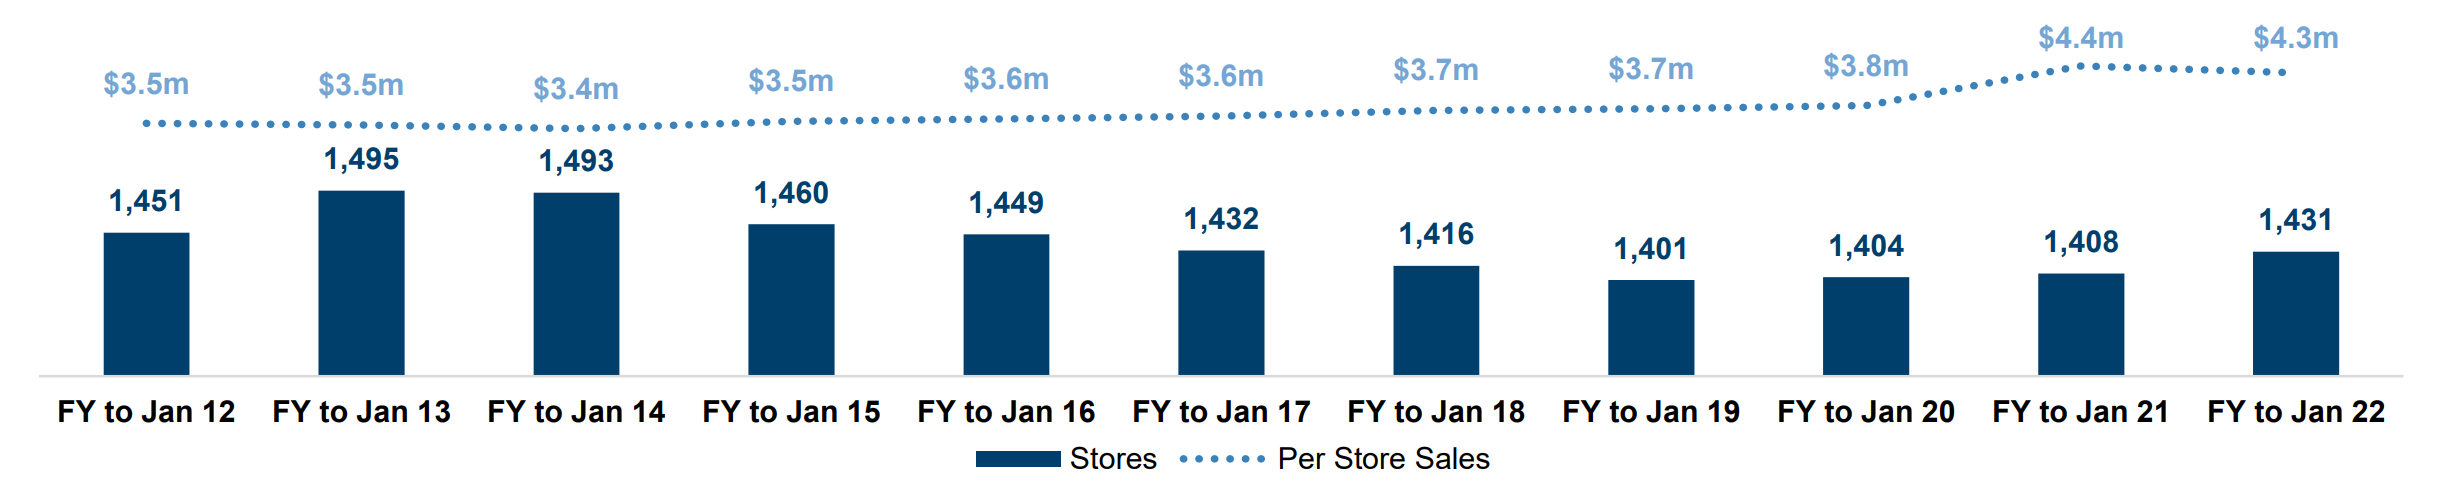
Beneath the headline figures, however, there is something interesting to note about sales: over the same time period (FY11 to FY19), the number of Big Lots stores declined ~3% from 1,451 to 1,404, implying per-store sales growth of a more meaningful 1.0% annualised over the eight years to FY19. This was largely achieved by increasing the size of individual stores, with average selling sq. ft of 22,582 per store in FY19, compared with 21,717 in FY11, and per-square foot sales growth of 0.47% annually (from $161.75/sq. ft in FY11 to $167.90/sq. ft in FY19). So, even though overall numbers were a little sluggish, there was a positive dynamism beneath the surface as the company opened and closed stores – with net closures every year of the past decade until FY18 – and improved sales in larger format stores. So far, all good.
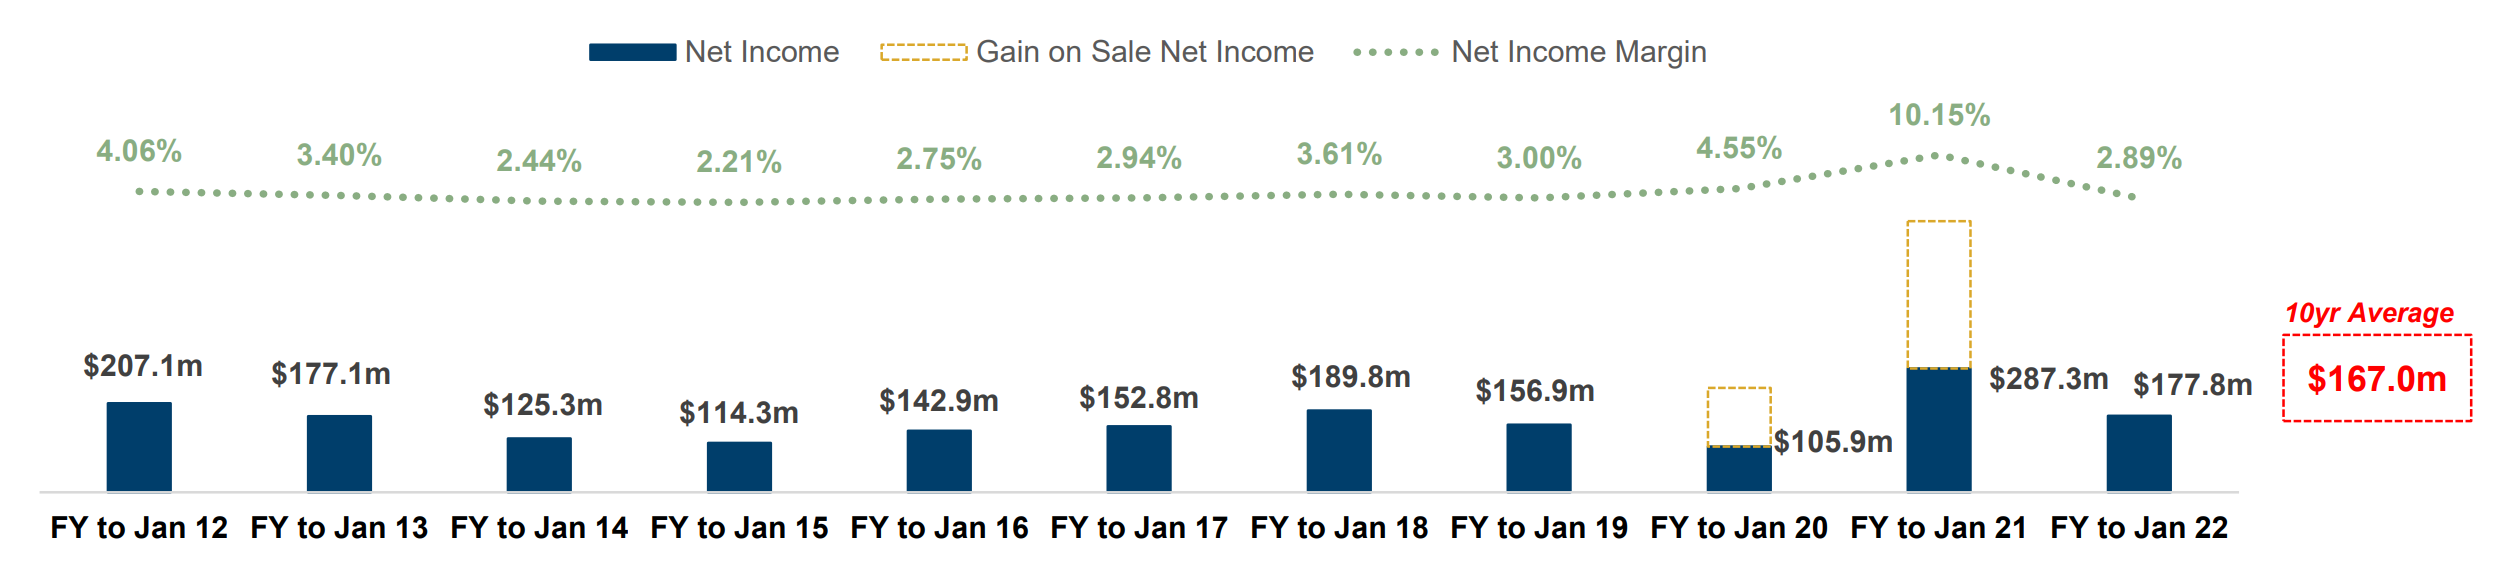
Below sales, gross margins have been pretty resilient, hovering around 39%, give or take 1%. (We’ll get to Q1 22 later… cue ominous warning….). Net income, although it has bounced around a little, has been similarly stable over time: the $177m from FY21 is pretty representative, with an average (excluding one-off gain-on-sale from real estate leasebacks1) of $167m over the past decade. Growth hasn’t really featured that much, and it pretty hard to realistically tease out of pretty choppy numbers. Choppy, but relatively stable around the mean.
What has really driven results for shareholders, though, is the relentless buyback activity of the company, which has destroyed diluted share outstanding: there were 69.4m diluted shares out in FY11, and only 33.4m in FY21 (and even fewer now…)

This is a significant difference, and means that the $177m earned in net income in FY12 yielded $2.93 / share, compared with the $5.33/share that the same corporate earnings provided in FY21. Juicy.

That is not to lather the company, or management, with heaps of pure praise for this: as value investing Substack superstar Andrew Walker points out, if they were willing to aggressively buy back stock at over $50, why are they now not using their extensive repurchase facility to buy it back at less than half of that? They haven’t shown – to date, they could surprise us – a great deal of discipline around buying back stock, so it isn’t all good news. However, it remains undeniable that the repurchase of shares has been accretive to EPS: whether they could have generated more EPS accretion by more sensibly allocating the capital is an open question, but hey. What this means in practice is that the $167m average net income has become more valuable to shareholders each year – on a per share basis – leaving us in a very interesting position when evaluating the company today.
The balance sheet, too, is free of any glaring issues, and may even have excess liquidity for potential acquirers (more below). At the end of FY21, BIG sported $1.7bn of net debt including leases, or $50.2m of net cash without operating leases, which is my preferred method of looking at things (side bleg: if anyone has an interesting piece on operating leases as part of the debt stack, I’d be curious to hear more viewpoints). This compares with operating cashflow of ~$290m on average, so, even if you whack in all the operating lease liabilities with none of the offsetting right-of-use assets (quite harsh in my view), you’re still only looking at c.6.0x net debt incl. leases to average annual operational cashflow. One final quick point about the business is the high degree of alignment between the management, Board and shareholders. Insider ownership is pretty good, and improving: in 2021, the Board increased stock ownership requirements for the CEO and Executive VPs from 5x and 2.5x of salary to 6x and 3x, respectively, and the Board itself has a 5x salary requirement for stock ownership for Outside Directors. Executive compensation, too, is strongly tied to meaningful performance metrics: cash bonuses are a combination of sales numbers (35%) and operating profit performance (65%), whilst Long-Term Equity Incentives are tied to TSR (20%), ROIC (40%) and EPS (40%). This is great to see: significant compensation is tied to metrics that really matter to shareholders, rather than generic metrics that can be gamed, and can mean nothing on a per-share basis. All executive offer compensation is subject to clawbacks, too, further aligning management to delivering real value for the long term. All positive indicators of a competent, well-incentivised management, and Board that understands what its job really is.
Q1 2022
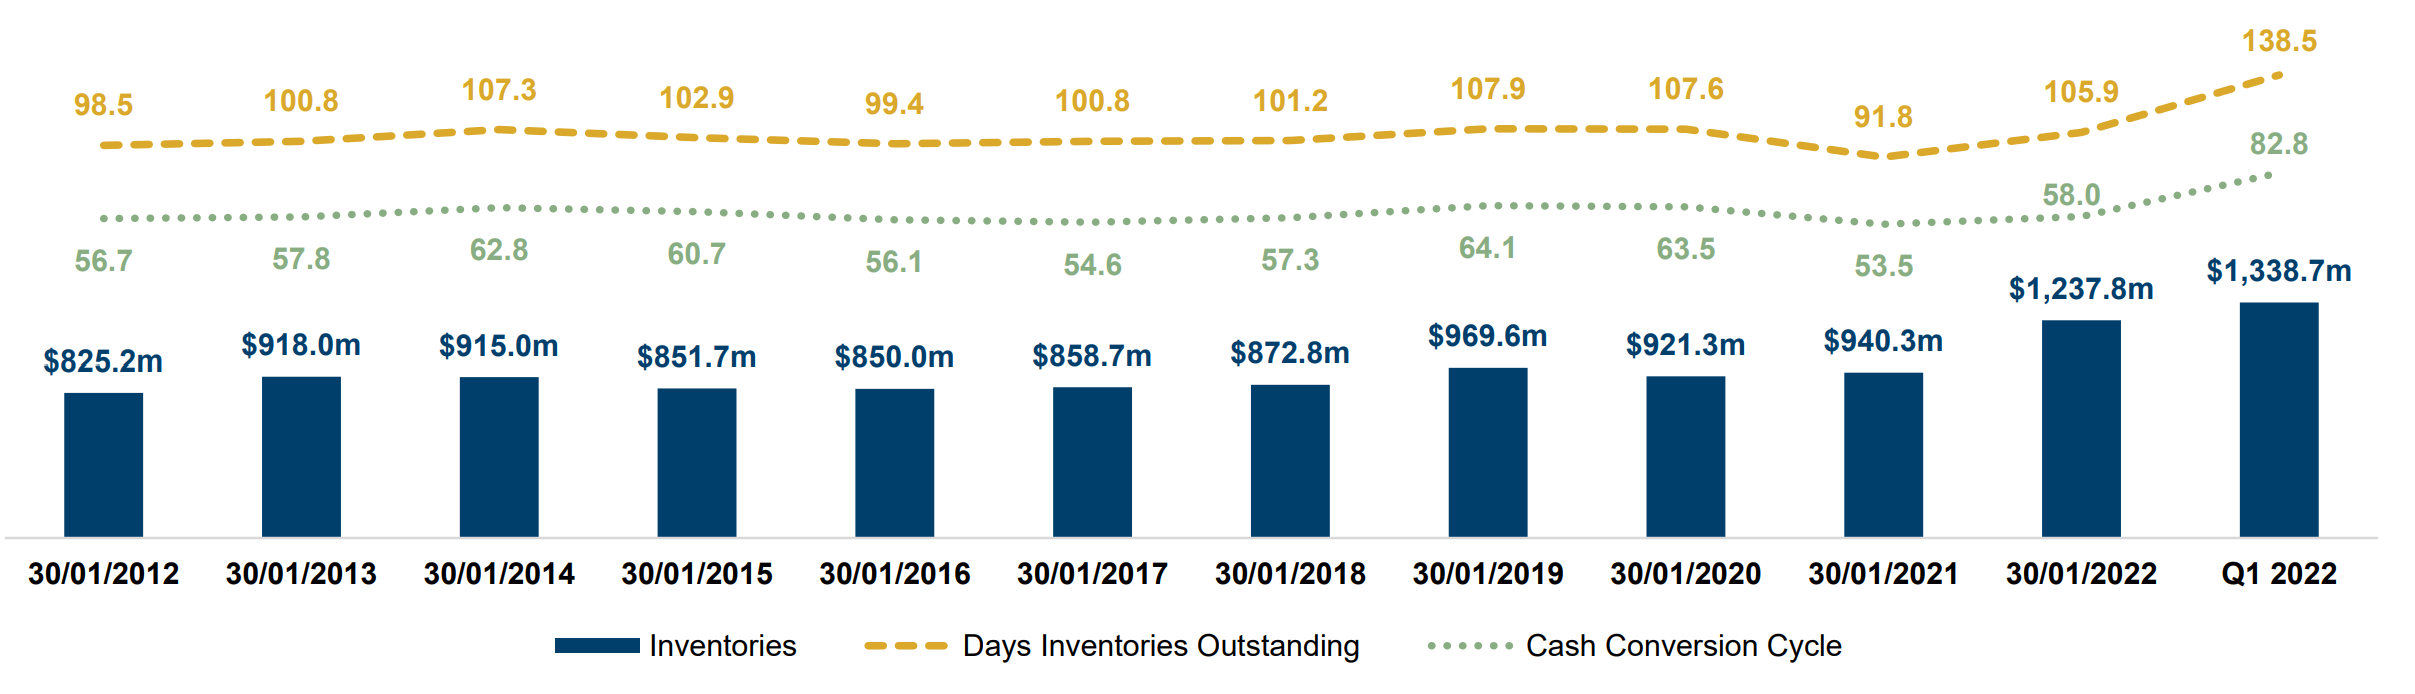
So: on to Q1 22. The company announced something similar to pretty much all US retailers, effectively admitting that inventory levels were too high (see chart below), which we can figure out for ourselves by looking at metrics from simple inventory levels, days inventories outstanding, and cash conversion cycle days. It’s a problem, folks: but not an insurmountable one. If there’s one thing that the management know how to do, it is clear excess inventory. In fact, although this will take a couple of quarters and weigh on margins, once they have cleared the backlog, they will be in prime position to take advantage of the fact that everyone else in America is going to have to do the same thing – and they will be the buyers. Management commented on the quarterly call that they are seeing excellent pricing in the market, and they are aggressively building buying capacity to take advantage, and pass savings to their bargain-hungry customers. Not that we need this to happen to be very happy making money here, but, you know, upside. In line with this inventory problem came margin pressure, and a quarterly loss of $11.1m, or $0.39/share, an annual run-rate of $1.55/share. The more eagle eyed of you will thus be noting the implied diluted share count of 28.6m at quarter-end; yet more repurchases? Alas, no. What has happened here is that, as the stock price has collapsed (down 58% this year so far…), a bunch of management options based on Total Shareholder Return (“TSR”) are not anywhere close to in the money, and so are excluded from the share count (more on management incentives later; heads up, they’re good). This, to me, seems like a heads-I-win, tails-I-lose scenario: if the share price does nothing, our per-share ownership of underlying earnings is (marginally) higher, but, if we get diluted by the TSR awards, well, it will be because the share price is materially higher.
Let’s pause to take quick stock of where we are: 28.6m shares out, with an average net income of $167m, and an average equity free cash flow of ~$143.1m (capex historically has been higher than depreciation charges by around 22%, so, being mean and ignoring growth capex in that number, let’s assume they are consistently understanding their real maintenance capex costs that are running through the income statement). That gives us $5.84/share of normalised net income, or $5.0/share of free cash flow. Assuming that TSR awards kick in, and share count goes back to FY21 year-end values of 33.4m (which ignores the possibility of ongoing intra-quarter share buybacks), and you get normalised EPS of $5.0/share, and free cash flow of $4.29. All of this can be yours, for the low low price of $23.03 (at the time of writing)!
Valuation
How does that look when we think about discounting this cash stream? As usual, putting on our Mr Miserable hats, let’s create a scenario. Say that they continue to lose money this year, to the tune of losing an average full year’s free cash flow, of $5.0/share. Recall that this is far higher than the current run rate net income loss from Q1, which they have guided (who know how much I believe their guidance) to worsen a bit in Q2, and recover nicely in Q3 and Q4 as they wriggle out of the inventory overhang, and elevated detention and demurrage charges (esoteric shipping charges) which are chomping margins in the first half of this year. But, as I say, let’s ignore that, and assume the worst. So, a $5.0/share loss in FY22. Then, for no real reason other than conservative pessimism, and stupidity insurance, let’s assume they still don’t emerge from those issues in 2023, and earn only half of their normalised equity free cash flow. Vague and imprecise, sure, but I think a pretty conservative case that leaves us lots of room to be wrong, and still avoid losing money. So, FY23 at $2.50/share (for those of you seeing 2023 and screaming “recession”: patience, patience. We will get there). Then, let’s assume that the company earns its normalised free cash flow of $5.0/share in 2024 and each year thereafter, building in no assumed annual growth. As usual, I’ll take the lower of a present value of free cash flow to equity (with a Gordon growth terminal value at the end), or distributed cash (dividends) plus the terminal value of retained cash and the company terminal value, using a simple Gordon growth approach. This gives me a ballpark intrinsic value in the region of $48 – $56 / share, again with 0% growth over the next decade, and 2.0% terminal growth rate. That represents an intrinsic value that sits 111% - 144% above where the equity is currently being priced in the market. Even if we are hyper severe, and apply a discount rate of 15% to these already pretty miserable forecasts, we get an intrinsic value of $28/share, 21% above what we are paying today. If we add in a little growth over the next decade (per Operation North Star, more below), say, 2.5% per annum from 2024, we are looking at more like $56 - $65 / share, premiums of 141% - 181% what we can currently pay. At 15% discount rates, the intrinsic value per share is $31, a 36.2% margin of safety. Again, all of this is with far-worse-than-expected results over the next two years, and off a foundation of a company that has performed extremely well operationally over the past decade and beyond. Overall, I feel pretty confident in my assessment that BIG is worth in the region of at least $50 today – and I’m not the only one.
Mill Road Capital
In March 2022, investor Mill Road Capital sent a letter to the Board of Directors of BIG, praising the management and operations of the company, and bemoaning the lack of public market appreciation for the intrinsic value. They pushed for a sale at a $50 - $70 per share range, well above the c.$20 they paid in Q4 2020. Now, I’m not saying that Mill Road Capital are our friends, or pushing for the best outcome for investors: however, it is nice to have a clearly laid out argument that puts the value in the region with which we ourselves independently agree. In fact, in an effort to woo private equity money, Mill Road’s letter even lays out how the acquisition could be financed with internal cash, drawing down on credit lines and pursuing opportunistic sale-and-leaseback transactions with owned properties to generate capital. From my perspective, this makes no difference to my evaluation or assessment, but it does add a potential acquisition as something more tangible on the horizon, and puts a ballpark per-share value on that outcome. Worth knowing.
Final Thoughts
Hopefully, I have clearly laid out my view as to why (i) BIG is a good company, with a demonstrated track record of solid results and (ii) why that business is deeply discounted at today’s prices. There are a few other things I want to mention, in no particular order, that I think are worthwhile to know.
First is thinking about how BIG performed during the financial crises, the most recent recession that crippled the US consumer (COVID being the weird exception where consumer spending was super strong). In FY06, sales of $4.7bn yielded net income of $124m, which rose to $158.5m in FY07 on basically flat sales. All they way through to FY10, gross margins stayed flat or improved marginally, again hovering around 40%, with sales actually growing from $4.7bn to $5.0bn over the same period. On company calls, management note the recession robust (I like to avoid the absolute word ‘resistant’) business model, which attracts higher income customers who trade down during consumer squeezes. Management note that this has been the case during May 2022 so far, and was the case in the financial crisis at the end of the last decade. I don’t have any macro views, but, for those who are concerned about a looming recession, BIG certainly has what it takes to survive – and to succeed.
The last point to mention is management’s current strategic plan, the aforementioned Operation North Star. Announced on March 3rd, this is a plan to grow the business over the coming decade, by expanding store footprint by ~500 units over the next five years, whilst increasing gross margin by 100 – 200 bps. BIG are targeting $8bn - $10bn in revenue, operating margins of 6% - 8% and ROIC of 20% - 25% (as they measure it). I have no view or sense of whether this is achievable and will happen – but, as we noted when thinking about valuation, the current market prices are pretty despondent even when incorporating no growth; any growth that the management can actually deliver by implementing this plan will just be gravy.
Conclusion
A strong, healthy business with a well-incentivised management, great track record, short-term headwinds and long-term opportunities, solid balance sheet, valued at something in the region of 40% of a super-duper conservative estimate of intrinsic value? Count Amory in.
This is where a company owns an asset - e.g. a Big Lots store - and sells it to a third party, usually an investor, with an agreement to lease it back from them over a set period. This releases a lump sum of cash for the business, and generates stable income for the third party investor
very impressive analysis